LIXA Performances II (reloaded)
Abstract
In the main discussion the performance of LIXA are reported for a typical deployment: one (or more) VMs with the Application Program and one VM with the LIXA state server. Microservices architecture are mainly based on Kubernetes and Kubernetes provides pods that support the concept of sidecar containers. When containers are deployed in the same pod, the communication among the containers of the same pod does not have to travel on the physical underlying network. How does LIXA might perform when the state server is colocated in the same VM of the Application Program?
You can look at the figures reported in this article to discover that using LIXA in a colocated architecture you can execute thousands of transactions per second introducing few milliseconds of latency in your transactions.
Introduction
All the measures reported in this section have been collected using a single VM in Azure public cloud West Europe region.
The virtual machine is configured as below:
- Operating system: Ubuntu Linux 18.04-LTS
- VM generation: V1
- Size: Standard D4s v3
- vCPUS: 4
- RAM: 16 GiB
- Azure disk encryption: Enabled
- Disk Size: 30 GiB
- Disk Storage account: Premium SSD
- Disk Encryption: SSE with PMK
- Disk Host caching: Read/write
Benchmark Architecture
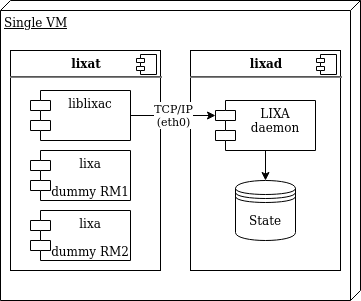
As shown in the above image, the components used to perform the performance tests are:
- VM: a D4s v3 Azure Virtual machine to host all the programs
- lixat: an utility provided by LIXA to perform testing
- liblixac: the library used to manage the transaction and to communicate with the state server (lixad)
- lixa dummy RM1, lixa dummy RM2: a couple of dummy Resource Managers, they behave as a real XA Resource Manager, but reply to the caller immediately
- lixad: the LIXA state server
- LIXA daemon: the process of lixad
- State: state files on disk used by lixad to persist the state in the event of crash/restart
Important Notes on Benchmark Architecture:
- dummy Resource Managers introduce quite zero delay: real life Resource Managers require some time to perform XA functions. This must be considered a worst case condition to measure the overhead introduced by LIXA
- dummy Resource Managers introduce quite zero delay, real life Resource Managers can perform worse when using the XA two phase commit protocol in comparison with non XA single phase commit. This must be considered a best case condition with regards of the overhead introduced by real Resource Managers
- lixat and lixad are deployed in distinct Virtual Machines inside the same Azure region: this is necessary to introduce the network latency and the correlated jitter that’s a noise from measurement perspective
- state files are saved inside a standard Premium SSD disk: lixad is a write mostly application and generates a lot of stress on the disk (this aspect will be further described below)
How the Benchmark Works
lixat is a multithreaded Application Program that uses the TX (Transaction Demarcation) interface to execute XA distributed transaction. Every thread performs the same number of transactions, one after the previous one. The logic can be described as below:
loop
    wait some time (t1)
    tx_open()
    wait some time (t1)
    tx_begin()
    wait some time (t2)
    tx_commit()
    wait some time (t1)
    tx_close()
- t1 is used to simulate the “thinking time” of a real Application Program
- t2 is used to simulate the “thinking time” of a couple of real Resource Managers, like for example SQL statements or message PUT/GET
Both t1 and t2 are randomly distributed to simulate a more realistic scenario.
In every cycle of the loop, the connection is opened (tx_open) and closed (tx_close): this can be considered a typical behavior for an online service; lixat can even simulate a batch process with a single pair of tx_open/tx_close and many tx_begin/tx_commit, but the figures presented below are related to an online service behavior.
Note: due to the 0-latency of the dummy Resource Managers, tx_open(), tx_begin(), tx_commit() and tx_close() measure only the overhead introduced by LIXA. They do not measure the overhead introduced by Resource Managers in performing XA functions.
Three parameters are available to change the workload injected in the system:
- the number of concurrent threads: the higher the number, the higher the workload
- t1: the lower t1, the higher the workload, because transactions are executed faster
- t2: the lower t2, the higher the workload, because transactions are executed faster
How tests have been performed
For every test the following procedure was used:
- lixad: clean-up of /opt/lixa/var/ directory to remove the previous state files
- lixad: export of environment variable LIXA_STATE_ENGINE to choose the proper state engine
- lixad: start of the state server with /opt/lixa/sbin/lixad
- lixat: start of the benchmark with a command like
for l in 4 8 12 16 20 24 28 32 36 40 ; do /opt/lixa/bin/lixat -b -s -o -l $l -C 1000 ; done
The number of cycles, for every thread, was fixed to 1000; as a consequence, every collected statistic comes from a number of samples between 4K and 40K. Nevertheless, the collected data are affected by non negligible noise as advised in the below note.
Note: the tests have been performed in a public cloud environment and they are affected by non negligible noise. The previous statement should warn the reader to avoid considering absolute values the figures reported: all the data must be intended to provide general advices that must be confirmed in a real production environment.
Special Note Related to XTA:
even if the benchmark uses the TX interface, both TX and XTA use the same common layer (library liblixac) and there should not be relevant differences, with regards to the type of distributed transactions depicted in the above image, between TX and XTA.
LIXA State Server Engines
Starting with version 1.9.0, the LIXA State Server supplies two distinct State Engines:
- TRADITIONAL: this is the battle tested, original State Engine
- JOURNAL: a more complex State Engine that provides better performances in most situations
The figures reported below compare the behavior of the two State Engines when different workloads and different configurations are applied.
RPO: Recovery Point Objective
LIXA State Server provides parameters that can alter the RPO of the saved state in the event of crash. As a general rule, the lower the RPO, the higher the pressure on the disk subsystem and the lower the workload that a single LIXA State Server can handle.
The figures reported below are classified even from the RPO perspective.
Note: default LIXA configuration assumes that the user desire RPO=0, but this is not necessarily true, depending on the environment and the use case. Please refer to the Tuning chapter in the LIXA Reference Guide for more details on this.
Data
All the data are available for consultation in OpenDocument format.
LIXA Performances Key Points
In this section key figures are reported: all the charts represent the trade-off between the number of Transactions per Second (tps) on the Y axis and the 95th percentile of the Total Latency introduced by LIXA in the overall transaction elapsed time. Figures are reported following two analysis paths:
- the quantity of injected workload classified as “Medium”, “High” and “Extreme” (exact definition is available in the following sections)
- the RPO configured for the LIXA State Server (much more details are available in the following sections)
Characteristic Curves for RPO=0ms
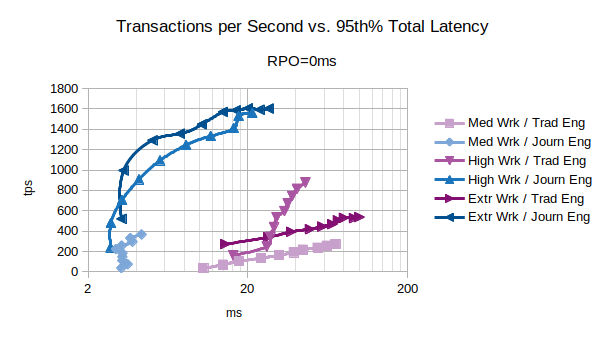
The chart shows that the Journal state engine provides a better performances for every type of workload. The curve Extr Wrk / Journ Eng shows that the system can execute up to:
- 1000 tps introducing 3 ms of latency
- 1300 tps introducing 5 ms of latency
- 1500 tps introducing 10 ms of latency
Characteristic Curves for RPO about 5ms
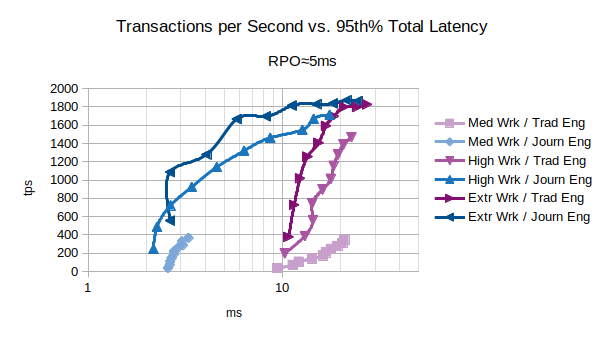
Accepting an RPO about 5ms, the Journal state engine provides even better performances reaching 1000 tps introducing about 2.6 ms of latency.
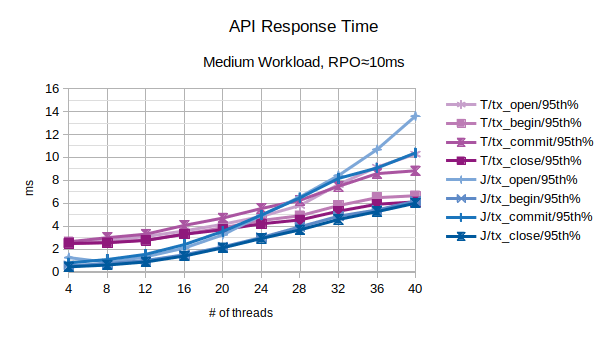
Characteristic Curves for RPO about 10ms
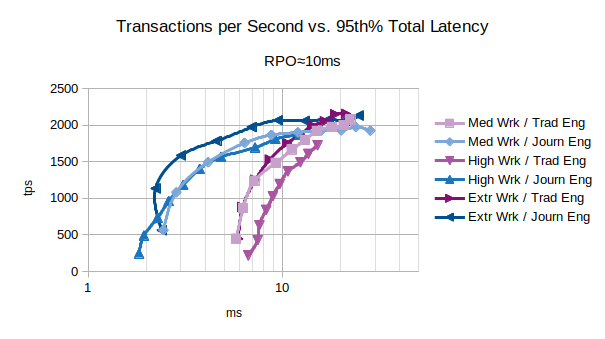
If your use case is compatible with an RPO about 10ms, the Traditional state engine can provide a quite astonishing performance reaching 2000 tps introducing about 8 ms of latency with a single LIXA State Server. Even for this RPO, if low latency is a must, the Journal state engine can execute:
- 1100 tps introducing 2.2 ms of latency
- 1600 tps introducing 3 ms of latency
Characteristic Curves for Medium Workload
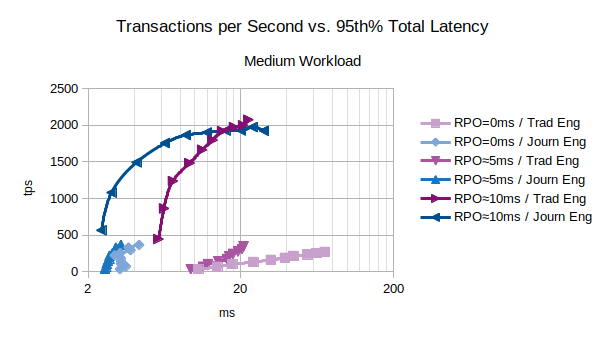
The chart shows that the Journal state engine provides a better performances for every RPO in presence of a medium workload.
Characteristic Curves for High Workload
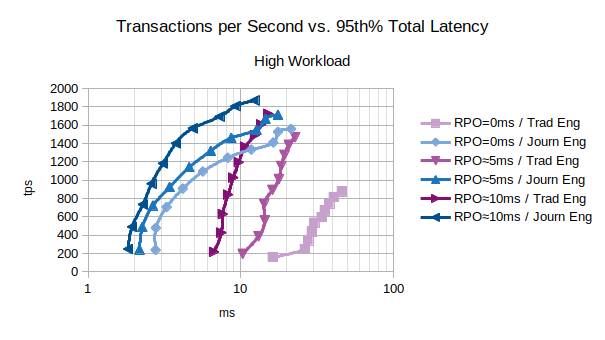
The chart shows that the Journal state engine provides the best performance in all the cases.
Characteristic Curves for Extreme Workload
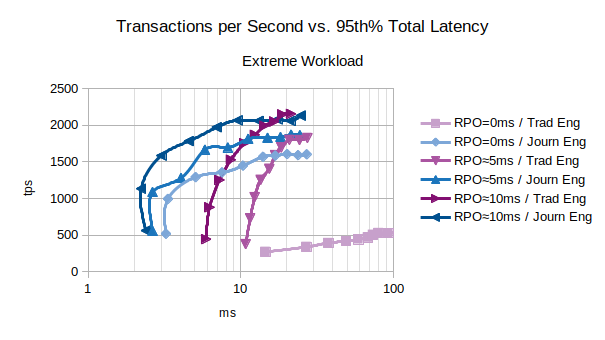
The chart shows that the Journal state engine provides the best performance in most cases.
LIXA Performances Summary
Even in the most severe condition (state server RPO=0ms), LIXA can manage 1000 transactions per second introducing a maximum latency of about 3.3 ms considering 95% of the total managed transactions. If your environment requires more transactions per second you can horizontally scale the number of LIXA State Servers accordingly with your needs.
Figures, Charts & Explanations
In this section detailed figures are reported: all the charts put the number of (client) threads on the X axis to show the basic results collected during the tests.
Medium Workload (slow RMs), RPO=0, Default Parameters
The first series of charts is related to the behavior in presence of a medium workload with default parameters and RPO=0:
- t1 is in range 500-1500 microseconds
- t2 is in range 50-150 milliseconds, this can be associated to the behavior of slow Resource Managers: both RMs takes 25-75ms, on average, to perform they operation (inserting data, deleting a message, and so on…)
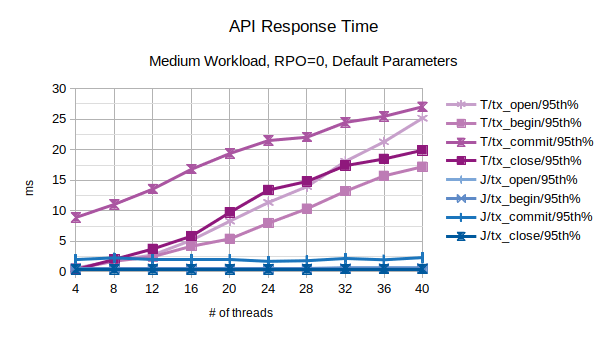
All the points in the above chart are related to the 95th percentile values; series prefixed with “T” are related to the traditional state engine, series prefixed with “J” are related to the journal state engine. From this chart, the journal state engine appears to scale much better when the number of concurrent threads increases.
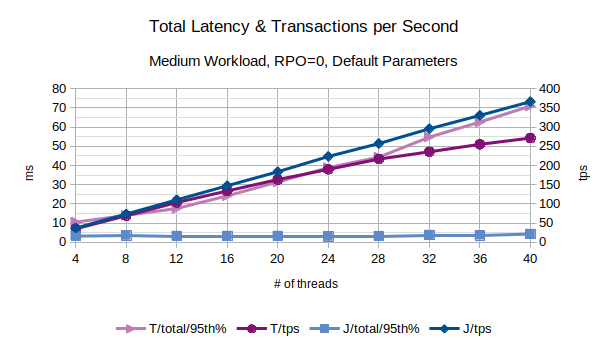
In the above chart are represented the 95th percentile values of the total latency introduced by LIXA in the transactions as the sum of open+begin+commit+close and the number of transactions per second that have been executed; series prefixed with “T” are related to the traditional state engine, series prefixed with “J” are related to the journal state engine. From this chart, the journal state engine appears to provide an overall better performance because it introduces a lower latency and provides an higher number of transactions per second.
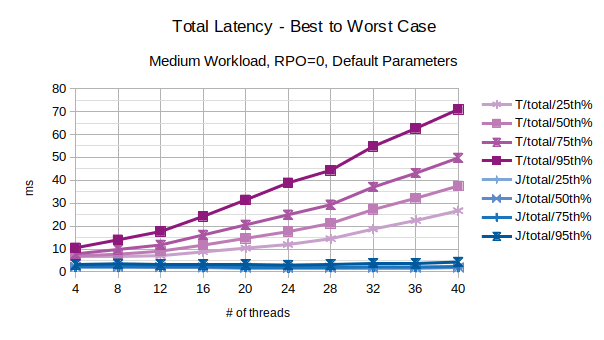
With the exception of the outliers, the above chart represents the characteristic latency introduced by LIXA:
- 25th% percentile can be considered an approximation of the best performance, the lowest latency
- 50th% percentile is the maximum latency of the best 50% transactions
- 75th% percentile is the maximum latency of the best 75% transactions
- 95th% percentile can be considered an approximation of the worst performance, the highest latency. Series prefixed with “T” are related to the traditional state engine, series prefixed with “J” are related to the journal state engine.
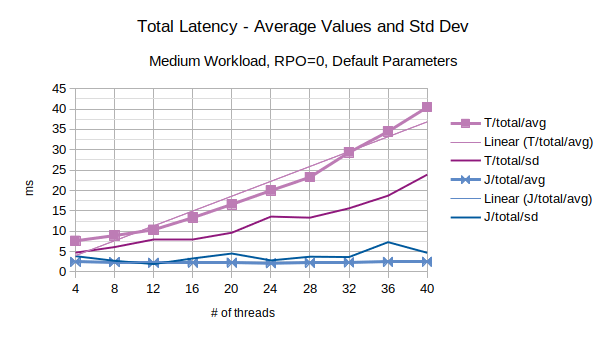
The last chart of the serie shows the average value of the total latency introduced by LIXA and the standard deviation of the total latency; series prefixed with “T” are related to the traditional state engine, series prefixed with “J” are related to the journal state engine. Journal state engine provides in this scenario an overall better performance than traditional state engine. It must be noted that standard deviation is quite high: this is the consequence of few outliers with very high values.
Linux Key Metrics
Peak key metrics of the D4s v3 Azure Virtual machine for traditional state engine:
- CPU: 13%
- Disk operations/sec: 755/s
peak key metrics for journal state engine:
- CPU: 19%
- Disk operations/sec: 415/s
Journal state engine uses more (user) CPU, but it optimizes the usage of the disk.
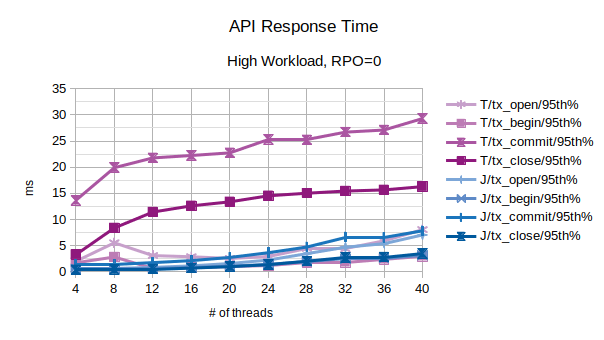
High Workload (normal RMs), RPO=0
The second series of charts is related to the behavior in presence of a high workload and RPO=0:
- t1 is in range 500-1500 microseconds
- t2 is in range 5-15 milliseconds, this can be associated to the behavior of good performance Resource Managers: both RMs takes 2.5-7.5ms, on average, to perform they operations (inserting data, deleting a message, and so on…).
Log parameters of LIXA state engine have been multiplied by 10 to accomplish the larger workload:
- lixad/log_size: 5242880
- lixad/max_buffer_log_size: 1310720
Log parameters are irrelevant for traditional state server because it does not use log files.
All the points in the above chart are related to the 95th percentile values; series prefixed with “T” are related to the traditional state engine, series prefixed with “J” are related to the journal state engine. From this chart, the journal state engine appears to scale much better when the number of concurrent threads increases.
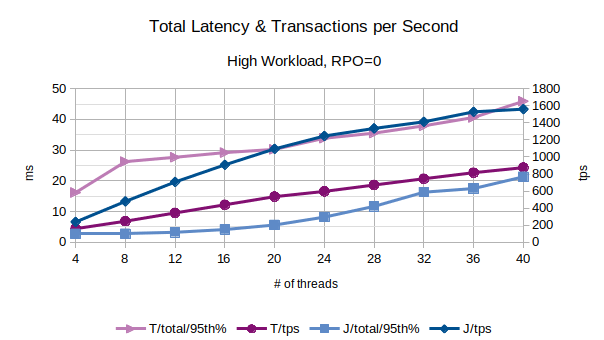
In the above chart are represented the 95th percentile values of the total latency introduced by LIXA in the transactions as the sum of open+begin+commit+close and the number of transactions per second that have been executed; series prefixed with “T” are related to the traditional state engine, series prefixed with “J” are related to the journal state engine.
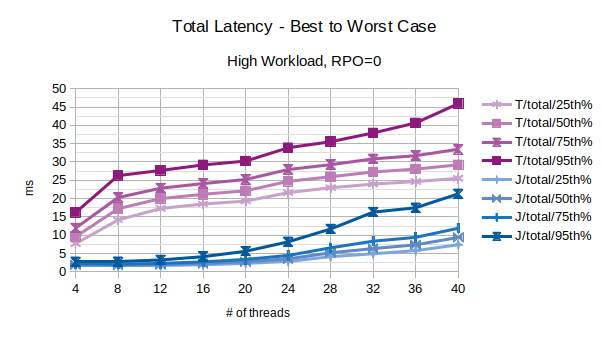
With the exception of the outliers, the above chart represents the characteristic latency introduced by LIXA:
- 25th% percentile can be considered an approximation of the best performance, the lowest latency
- 50th% percentile is the maximum latency of the best 50% transactions
- 75th% percentile is the maximum latency of the best 75% transactions
- 95th% percentile can be considered an approximation of the worst performance, the highest latency. Series prefixed with “T” are related to the traditional state engine, series prefixed with “J” are related to the journal state engine.
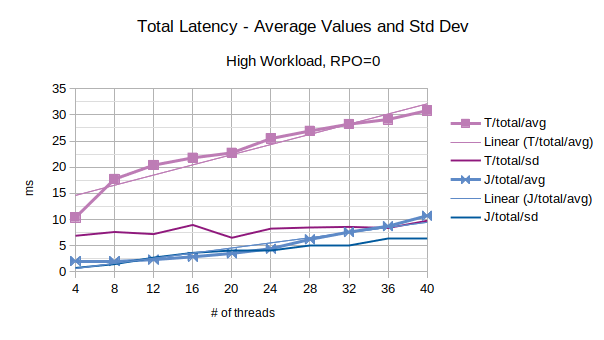
The last chart of the serie shows the average value of the total latency introduced by LIXA and the standard deviation of the total latency; series prefixed with “T” are related to the traditional state engine, series prefixed with “J” are related to the journal state engine. Journal state engine provides in this scenario an overall better performance than traditional state engine.
Linux Key Metrics
Peak key metrics of the D4s v3 Azure Virtual machine for traditional state engine:
- CPU: 32%
- Disk operations/sec: 853/s
peak key metrics for journal state engine:
- CPU: 66%
- Disk operations/sec: 1120/s
Extreme Workload (normal RMs), RPO=0
The third series of charts is related to the behavior in presence of an extreme workload and RPO=0:
- t1 is in range 500-1500 microseconds
- t2 is in range 500-1500 microseconds, this can be associated to the behavior of fast Resource Managers: both RMs takes 250-750 microseconds, on average, to perform they operation (inserting data, deleting a message, and so on…).
Log parameters of LIXA state engine have been multiplied by 100 to accomplish the larger workload:
- lixad/log_size: 52428800
- lixad/max_buffer_log_size: 13107200
The above parameters are irrelevant for traditional state server because it does not use log files.
Note: this workload must be considered extreme because the time used by each RM is below the network latency and below the storage latency. Only a colocated Resource Manager implemented using an in memory approach can reach these low latencies. Anyway, the figures are interesting to discover the behavior of LIXA under such extreme conditions.
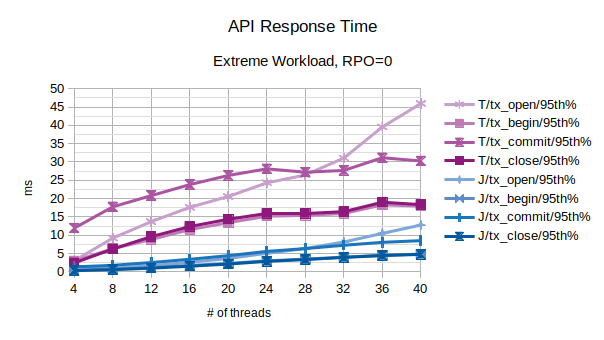
All the points in the above chart are related to the 95th percentile values; series prefixed with “T” are related to the traditional state engine, series prefixed with “J” are related to the journal state engine. From this chart, the journal state engine appears to scale much better when the number of concurrent threads increases. After 28 concurrent client threads, both the configurations start to slow down, but journal state engine performs much better in terms of accepting new clients (tx_open).
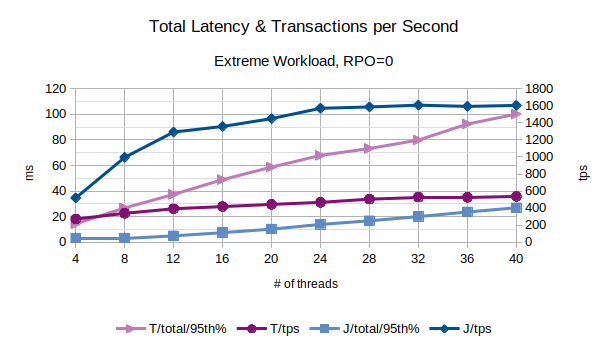
In the above chart are represented the 95th percentile values of the total latency introduced by LIXA in the transactions as the sum of open+begin+commit+close and the number of transactions per second that have been executed; series prefixed with “T” are related to the traditional state engine, series prefixed with “J” are related to the journal state engine. The figures show that journal state engine reaches a peak of about 1600 transactions per second with more than 20 concurrent threads.
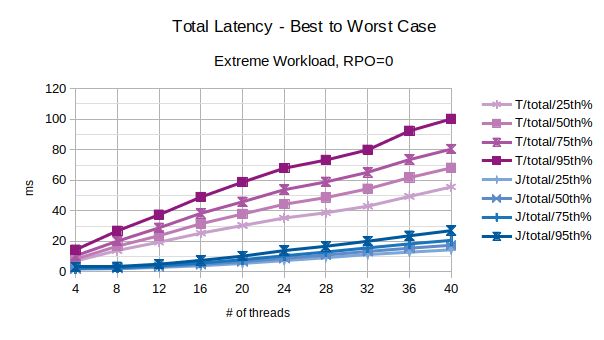
With the exception of the outliers, the above chart represents the characteristic latency introduced by LIXA:
- 25th% percentile can be considered an approximation the best performance, the lowest latency
- 50th% percentile is the maximum latency of the best 50% transactions
- 75th% percentile is the maximum latency of the best 75% transactions
- 95th% percentile can be considered an approximation of the worst performance, the highest latency. Series prefixed with “T” are related to the traditional state engine, series prefixed with “J” are related to the journal state engine.
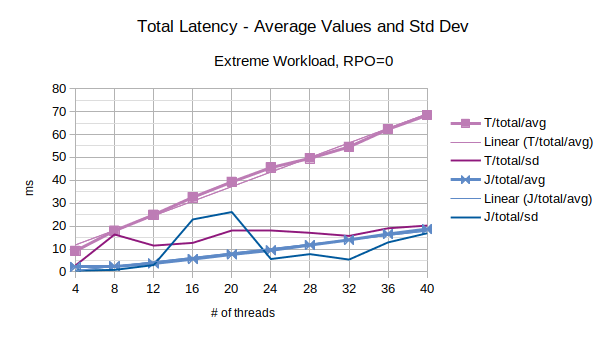
The last chart of the serie shows the average value of the total latency introduced by LIXA and the standard deviation of the total latency; series prefixed with “T” are related to the traditional state engine, series prefixed with “J” are related to the journal state engine. Journal state engine provides in this scenario an overall better performance than traditional state engine. It must be noted that standard deviation is sometimes very high: this is the consequence of few outliers with very high values.
Linux Key Metrics
Peak key metrics of the D4s v3 Azure Virtual machine for traditional state engine:
- CPU: 26%
- Disk operations/sec: 1210/s
peak key metrics for journal state engine:
- CPU: 80%
- Disk operations/sec: 1090/s
Conclusions for RPO=0
RPO=0 requires that LIXA state server persists the transaction state as soon as possible, synchronizing the transaction executor. RPO=0 requires a lot of Disk Operations per second.
In presence of a medium (moderate) and high workload, before the system reaches saturation, both journal and traditional state engine provides linear scalability of the number of transactions per second, but only the journal state engine provides linear scalability even for the introduced latency.
In presence of an extreme workload, the journal state engine shows its quite good behavior, even if running in saturation for most of the time.
Not all the times RPO=0 is necessary
LIXA state server does not persist the data managed by Application Programs, but only the state of the distributed transactions performed to change the data: in the end, Resource Managers guarantee data consistency and, if the state of the Transaction Manager (LIXA) vanishes, data consistency can be manually fixed in every single Resource Manager. This is not ah happy path task, but it can be done.
Journal state engine, in comparison with traditional state engine, provides a further feature: if the underlying Linux Operating System does not crash, RPO is constantly kept to 0 with a continuous checksum of the state table files. In few words, if the event of crash for the Linux Operating System and/or the underlying hypervisor/hardware is negligible, RPO=0 is guaranteed by the journal state engine even without persisting data to disk as soon as possible.
Note: the above behavior does not apply to the traditional state engine.
In the next sections, the performances of the LIXA state server with RPO>0 will be shown.
Charts for RPO about 5ms
Setting parameter max_elapsed_sync_time=5 in lixad_conf.xml allows the LIXA state manager to postpone disk synchronization up to 5 milliseconds: this does not guarantee a precise RPO=5ms, but is equivalent to say “after maximum 5ms, the synchronization of the state to the persistent storage is started”. In other words, 5ms is a good approximation of the time window of the missed states in the event of crash.
Supposing your workload is about 200 transactions per second, you can forecast about 1 transaction to be manually recovered in the event of a crash.
Note: as stated above
- for traditional state engine any lixad state server crash might require transaction manually recovery
- for journal state engine only a crash at the operating system level might require transaction manually recovery
Medium Workload (slow RMs), RPO about 5ms
The first series of charts is related to the behavior in presence of a medium workload with parameter max_elapsed_sync_time=5 and RPO about 5,s:
- t1 is in range 500-1500 microseconds
- t2 is in range 50-150 milliseconds, this can be associated to the behavior of slow Resource Managers: both RMs takes 25-75ms, on average, to perform they operation (inserting data, deleting a message, and so on…)
All the points in the above chart are related to the 95th percentile values; series prefixed with “T” are related to the traditional state engine, series prefixed with “J” are related to the journal state engine. From this chart, the journal state engine appears to scale better when the number of concurrent threads increases.
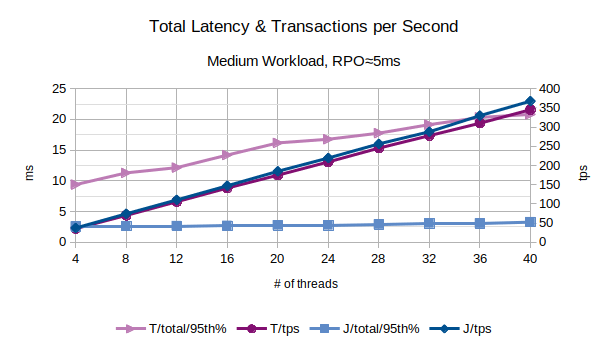
In the above chart are represented the 95th percentile values of the total latency introduced by LIXA in the transactions as the sum of open+begin+commit+close and the number of transactions per second that have been executed; series prefixed with “T” are related to the traditional state engine, series prefixed with “J” are related to the journal state engine. From this chart, the journal state engine appears to provide an overall better performance because it introduces a lower latency and provides a slightly higher number of transactions per second.
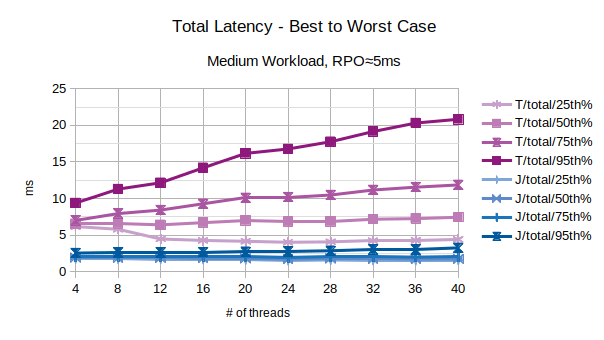
With the exception of the outliers, the above chart represents the characteristic latency introduced by LIXA:
- 25th% percentile can be considered an approximation of the best performance, the lowest latency
- 50th% percentile is the maximum latency of the best 50% transactions
- 75th% percentile is the maximum latency of the best 75% transactions
- 95th% percentile can be considered an approximation of the worst performance, the highest latency. Series prefixed with “T” are related to the traditional state engine, series prefixed with “J” are related to the journal state engine.
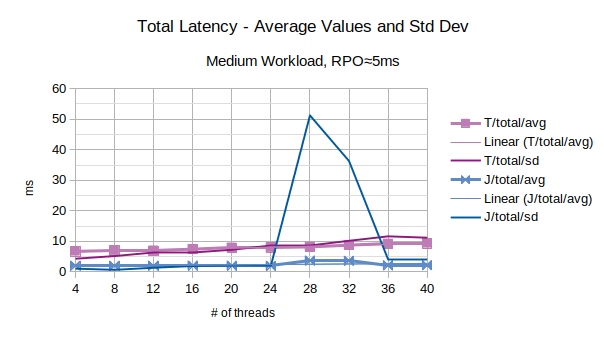
The last chart of the serie shows the average value of the total latency introduced by LIXA and the standard deviation of the total latency; series prefixed with “T” are related to the traditional state engine, series prefixed with “J” are related to the journal state engine. Journal state engine provides in this scenario an overall better performance than traditional state engine. It must be noted that standard deviation is very high: this is the consequence of few outliers with very high values.
Linux Key Metrics
Peak key metrics of the D4s v3 Azure Virtual machine for traditional state engine:
- CPU: 17%
- Disk operations/sec: 680/s
peak key metrics for journal state engine:
- CPU: 22%
- Disk operations/sec: 418/s
Journal state engine uses more (user) CPU.
High Workload (normal RMs), RPO about 5ms
The second series of charts is related to the behavior in presence of a high workload and RPO about 5ms:
- t1 is in range 500-1500 microseconds
- t2 is in range 5-15 milliseconds, this can be associated to the behavior of good performance Resource Managers: both RMs takes 2.5-7.5ms, on average, to perform they operations (inserting data, deleting a message, and so on…).
Log parameters of LIXA state engine have been multiplied by 10 to accomplish the larger workload:
- lixad/max_elapsed_sync_time: 5
- lixad/log_size: 5242880
- lixad/max_buffer_log_size: 1310720
Log parameters are irrelevant for traditional state server because it does not use log files.
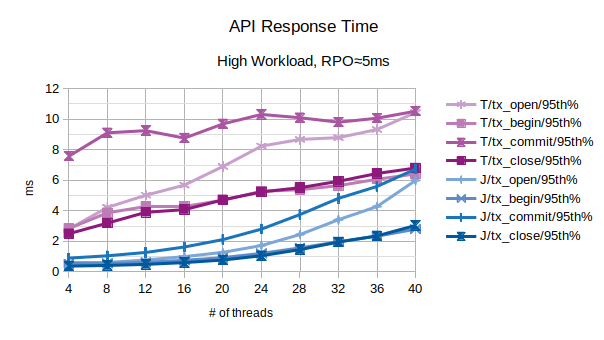
All the points in the above chart are related to the 95th percentile values; series prefixed with “T” are related to the traditional state engine, series prefixed with “J” are related to the journal state engine.
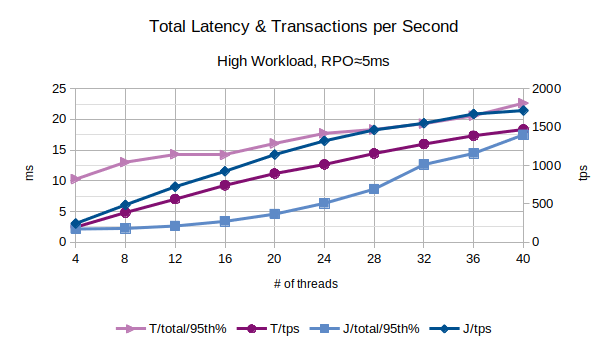
In the above chart are represented the 95th percentile values of the total latency introduced by LIXA in the transactions as the sum of open+begin+commit+close and the number of transactions per second that have been executed; series prefixed with “T” are related to the traditional state engine, series prefixed with “J” are related to the journal state engine.
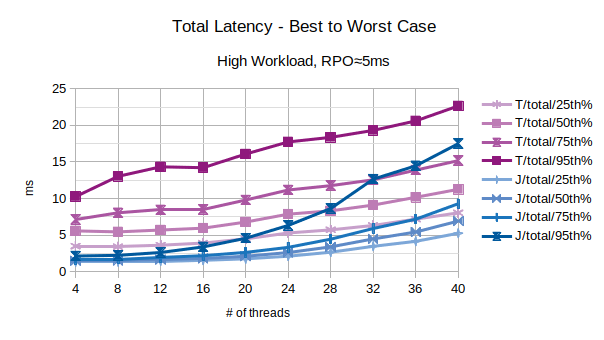
With the exception of the outliers, the above chart represents the characteristic latency introduced by LIXA:
- 25th% percentile can be considered an approximation of the best performance, the lowest latency
- 50th% percentile is the maximum latency of the best 50% transactions
- 75th% percentile is the maximum latency of the best 75% transactions
- 95th% percentile can be considered an approximation of the worst performance, the highest latency. Series prefixed with “T” are related to the traditional state engine, series prefixed with “J” are related to the journal state engine.
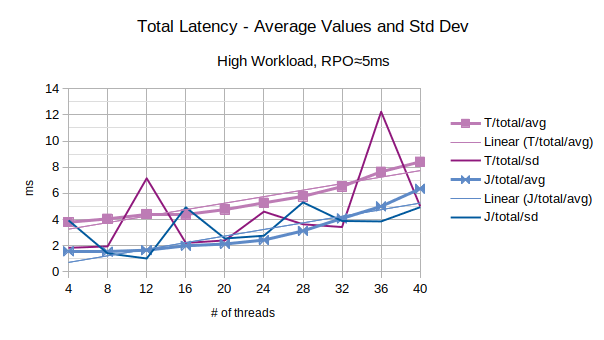
The last chart of the serie shows the average value of the total latency introduced by LIXA and the standard deviation of the total latency; series prefixed with “T” are related to the traditional state engine, series prefixed with “J” are related to the journal state engine. It must be noted that standard deviation is very high: this is the consequence of few outliers with very high values.
Linux Key Metrics
Peak key metrics of the D4s v3 Azure Virtual machine for traditional state engine:
- CPU: 50%
- Disk operations/sec: 776/s
peak key metrics for journal state engine:
- CPU: 73%
- Disk operations/sec: 1300/s
Extreme Workload (normal RMs), RPO about 5s
The third series of charts is related to the behavior in presence of an extreme workload and RPO about 5ms:
- t1 is in range 500-1500 microseconds
- t2 is in range 500-1500 microseconds, this can be associated to the behavior of fast Resource Managers: both RMs takes 250-750 microseconds, on average, to perform they operation (inserting data, deleting a message, and so on…).
Log parameters of LIXA state engine have been multiplied by 100 to accomplish the larger workload:
- lixad/max_elapsed_sync_time: 5
- lixad/log_size: 52428800
- lixad/max_buffer_log_size: 13107200
The above parameters related to log are irrelevant for traditional state server because it does not use log files.
Note: this workload must be considered extreme because the time used by each RM is below the network latency and below the storage latency. Only a colocated Resource Manager implemented using an in memory approach can reach these low latencies. Anyway, the figures are interesting to discover the behavior of LIXA under such extreme conditions.
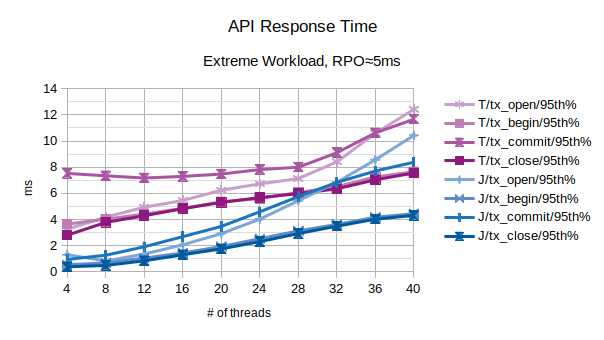
All the points in the above chart are related to the 95th percentile values; series prefixed with “T” are related to the traditional state engine, series prefixed with “J” are related to the journal state engine.
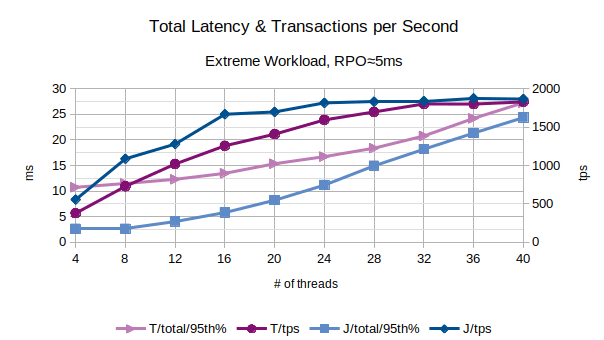
In the above chart are represented the 95th percentile values of the total latency introduced by LIXA in the transactions as the sum of open+begin+commit+close and the number of transactions per second that have been executed; series prefixed with “T” are related to the traditional state engine, series prefixed with “J” are related to the journal state engine.
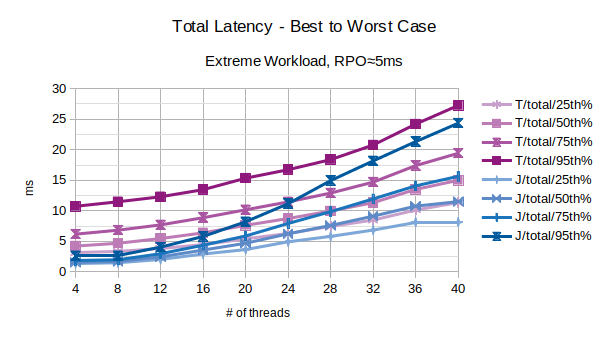
With the exception of the outliers, the above chart represents the characteristic latency introduced by LIXA:
- 25th% percentile can be considered an approximation the best performance, the lowest latency
- 50th% percentile is the maximum latency of the best 50% transactions
- 75th% percentile is the maximum latency of the best 75% transactions
- 95th% percentile can be considered an approximation of the worst performance, the highest latency. Series prefixed with “T” are related to the traditional state engine, series prefixed with “J” are related to the journal state engine. The figures show that the journal state engine provides overall better best performance.
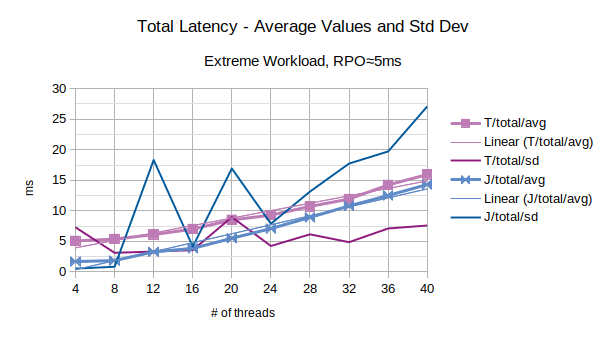
The last chart of the serie shows the average value of the total latency introduced by LIXA and the standard deviation of the total latency; series prefixed with “T” are related to the traditional state engine, series prefixed with “J” are related to the journal state engine. Journal and traditional state engines introduce quite the same average latency, but the standard deviation associated to the journal state engine is much higher.
Linux Key Metrics
Peak key metrics of the D4s v3 Azure Virtual machine for traditional state engine:
- CPU: 66%
- Disk operations/sec: 736/s
peak key metrics for journal state engine:
- CPU: 85%
- Disk operations/sec: 1340/s
Charts for RPO about 10ms
Setting parameters min_elapsed_sync_time=1 max_elapsed_sync_time=10 in lixad_conf.xml allows the LIXA state manager to postpone disk synchronization from 1 to 10 milliseconds: this does not guarantee a precise RPO=10ms, but is equivalent to say “after minimum 1ms and maximum 10ms, the state of the transaction starts to be synchronized on the persistent storage”. In other words, 10ms is a good approximation of the time window of the missed states in the event of crash. In comparison with the scenario “RPO about 5ms”, the additional parameter prevents disk synchronization before 1ms from the previous one.
Supposing your workload is about 200 transactions per second, you can forecast about 2 transaction to be manually recovered in the event of a crash.
Note: as stated above
- for traditional state engine any lixad state server crash might require transaction manually recovery
- for journal state engine only a crash at the operating system level might require transaction manually recovery
Medium Workload (slow RMs), RPO about 10ms
The first series of charts is related to the behavior in presence of a medium workload with parameter max_elapsed_sync_time=5 and RPO about 5,s:
- t1 is in range 500-1500 microseconds
- t2 is in range 50-150 milliseconds, this can be associated to the behavior of slow Resource Managers: both RMs takes 25-75ms, on average, to perform they operation (inserting data, deleting a message, and so on…)
All the points in the above chart are related to the 95th percentile values; series prefixed with “T” are related to the traditional state engine, series prefixed with “J” are related to the journal state engine.
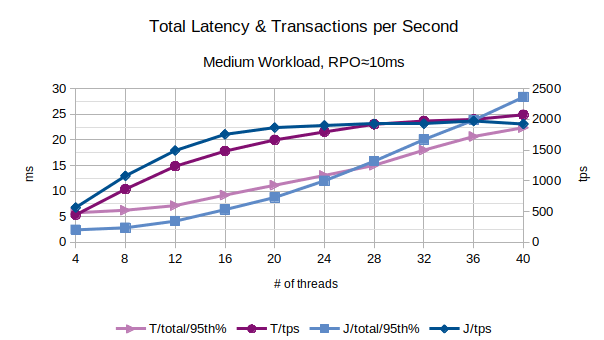
In the above chart are represented the 95th percentile values of the total latency introduced by LIXA in the transactions as the sum of open+begin+commit+close and the number of transactions per second that have been executed; series prefixed with “T” are related to the traditional state engine, series prefixed with “J” are related to the journal state engine. From this chart, the traditional state engine appears to provide a better performance for higher number of threads.
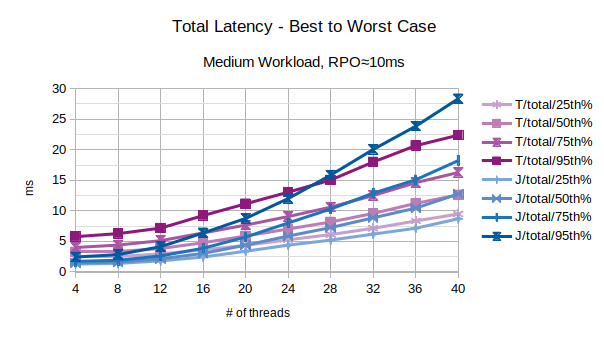
With the exception of the outliers, the above chart represents the characteristic latency introduced by LIXA:
- 25th% percentile can be considered an approximation of the best performance, the lowest latency
- 50th% percentile is the maximum latency of the best 50% transactions
- 75th% percentile is the maximum latency of the best 75% transactions
- 95th% percentile can be considered an approximation of the worst performance, the highest latency. Series prefixed with “T” are related to the traditional state engine, series prefixed with “J” are related to the journal state engine.
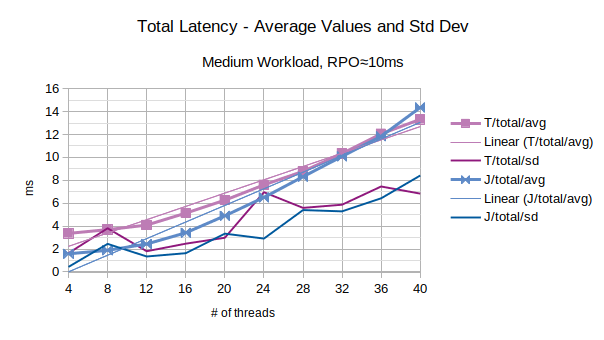
The last chart of the serie shows the average value of the total latency introduced by LIXA and the standard deviation of the total latency; series prefixed with “T” are related to the traditional state engine, series prefixed with “J” are related to the journal state engine. It must be noted that standard deviation is quite high: this is symptom of high noise in the measurements.
Linux Key Metrics
Peak key metrics of the D4s v3 Azure Virtual machine for traditional state engine:
- CPU: 68%
- Disk operations/sec: 660/s
peak key metrics for journal state engine:
- CPU: 83%
- Disk operations/sec: 729/s
Journal state engine uses more (user) CPU, but less disk operations.
High Workload (normal RMs), RPO about 10ms
The second series of charts is related to the behavior in presence of a high workload and RPO about 5ms:
- t1 is in range 500-1500 microseconds
- t2 is in range 5-15 milliseconds, this can be associated to the behavior of good performance Resource Managers: both RMs takes 2.5-7.5ms, on average, to perform they operations (inserting data, deleting a message, and so on…).
Log parameters of LIXA state engine have been multiplied by 10 to accomplish the larger workload:
- lixad/min_elapsed_sync_time: 1
- lixad/max_elapsed_sync_time: 10
- lixad/log_size: 5242880
- lixad/max_buffer_log_size: 1310720
Log parameters are irrelevant for traditional state server because it does not use log files.
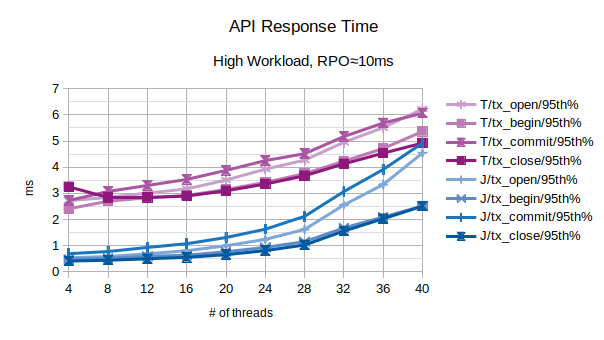
All the points in the above chart are related to the 95th percentile values; series prefixed with “T” are related to the traditional state engine, series prefixed with “J” are related to the journal state engine.
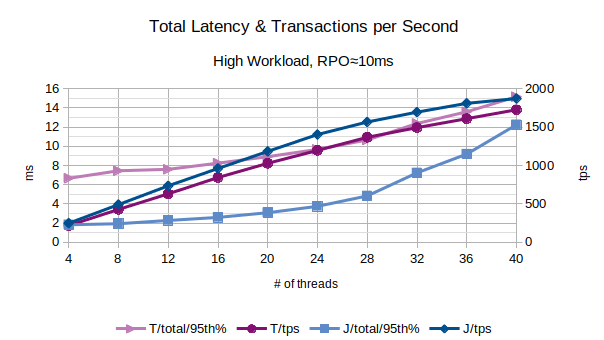
In the above chart are represented the 95th percentile values of the total latency introduced by LIXA in the transactions as the sum of open+begin+commit+close and the number of transactions per second that have been executed; series prefixed with “T” are related to the traditional state engine, series prefixed with “J” are related to the journal state engine.
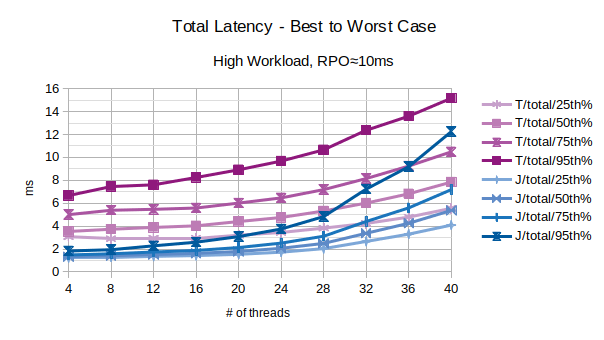
With the exception of the outliers, the above chart represents the characteristic latency introduced by LIXA:
- 25th% percentile can be considered an approximation of the best performance, the lowest latency
- 50th% percentile is the maximum latency of the best 50% transactions
- 75th% percentile is the maximum latency of the best 75% transactions
- 95th% percentile can be considered an approximation of the worst performance, the highest latency. Series prefixed with “T” are related to the traditional state engine, series prefixed with “J” are related to the journal state engine.

The last chart of the serie shows the average value of the total latency introduced by LIXA and the standard deviation of the total latency; series prefixed with “T” are related to the traditional state engine, series prefixed with “J” are related to the journal state engine.
Linux Key Metrics
Peak key metrics of the D4s v3 Azure Virtual machine for traditional state engine:
- CPU: 54%
- Disk operations/sec: 677/s
peak key metrics for journal state engine:
- CPU: 71%
- Disk operations/sec: 594/s
Extreme Workload (normal RMs), RPO about 10s
The third series of charts is related to the behavior in presence of an extreme workload and RPO about 10ms:
- t1 is in range 500-1500 microseconds
- t2 is in range 500-1500 microseconds, this can be associated to the behavior of fast Resource Managers: both RMs takes 250-750 microseconds, on average, to perform they operation (inserting data, deleting a message, and so on…).
Log parameters of LIXA state engine have been multiplied by 100 to accomplish the larger workload:
- lixad/min_elapsed_sync_time: 1
- lixad/max_elapsed_sync_time: 10
- lixad/log_size: 52428800
- lixad/max_buffer_log_size: 13107200
The above parameters related to log are irrelevant for traditional state server because it does not use log files.
Note: this workload must be considered extreme because the time used by each RM is below the network latency and below the storage latency. Only a colocated Resource Manager implemented using an in memory approach can reach this sort of latencies. Anyway, the figures are interesting to discover the behavior of LIXA under such extreme conditions.
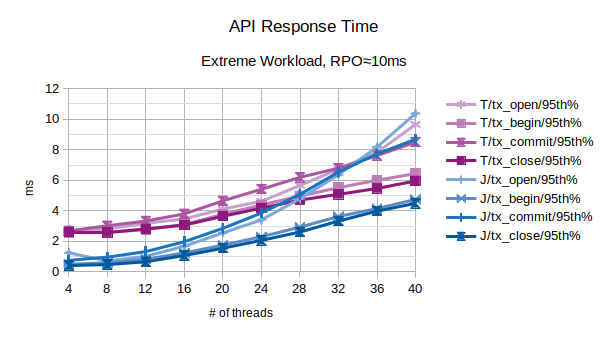
All the points in the above chart are related to the 95th percentile values; series prefixed with “T” are related to the traditional state engine, series prefixed with “J” are related to the journal state engine. From this chart, the traditional state engine appears to scale slightly better when the number of concurrent threads increases.
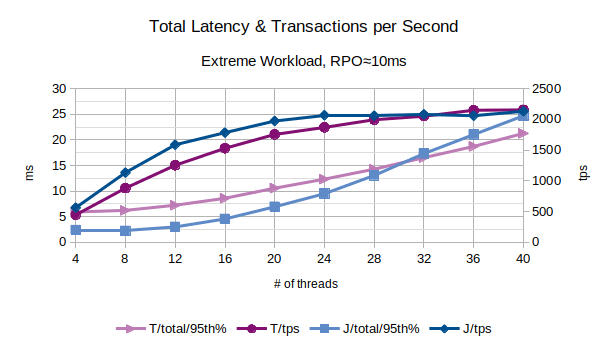
In the above chart are represented the 95th percentile values of the total latency introduced by LIXA in the transactions as the sum of open+begin+commit+close and the number of transactions per second that have been executed; series prefixed with “T” are related to the traditional state engine, series prefixed with “J” are related to the journal state engine. The figures show that the traditional state engine sustain quite the same workload and introduces a lower latency, with the exception of the lower numbers of client threads.
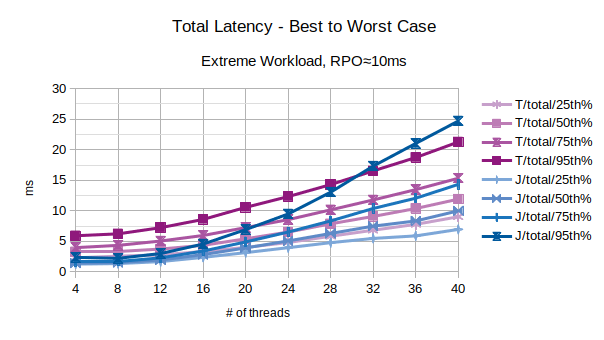
With the exception of the outliers, the above chart represents the characteristic latency introduced by LIXA:
- 25th% percentile can be considered an approximation the best performance, the lowest latency
- 50th% percentile is the maximum latency of the best 50% transactions
- 75th% percentile is the maximum latency of the best 75% transactions
- 95th% percentile can be considered an approximation of the worst performance, the highest latency. Series prefixed with “T” are related to the traditional state engine, series prefixed with “J” are related to the journal state engine.
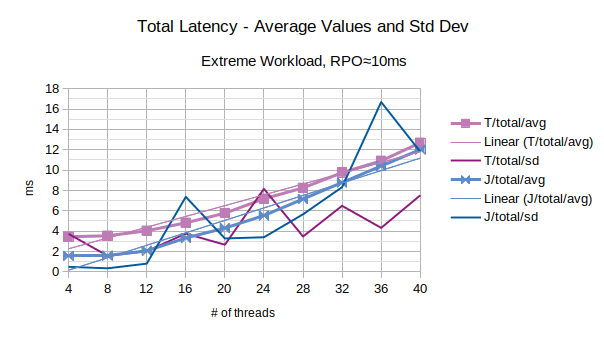
The last chart of the serie shows the average value of the total latency introduced by LIXA and the standard deviation of the total latency; series prefixed with “T” are related to the traditional state engine, series prefixed with “J” are related to the journal state engine.
Linux Key Metrics
Peak key metrics of the D4s v3 Azure Virtual machine for traditional state engine:
- CPU: 69%
- Disk operations/sec: 536/s
peak key metrics for journal state engine:
- CPU: 85%
- Disk operations/sec: 704/s
Final Notes on “Figures, Charts & Explanations”
Raw data shows that under some circumstances, the traditional state engine provides better figures. The reader must pay attention that such better figures are mainly related to saturation conditions that are of no practical use.
In other words: in some situations the traditional state engine can sustain higher rates of transactions per second in comparison with the journal state engine, but the behaviour is related to an oversaturation condition that is of no interest because the latency introduced is high.
Raw data shows another important fact: the environment used for the benchmark (Microsoft Azure) is noisy. LIXA shows a linear dependency between the injected workload and the average latency in any condition, but the standard deviation is sometime high or very high.